I only recently bought Aviva (LSE:AV.) shares because I was slow to the party. As a result, I may have missed out on the best returns.
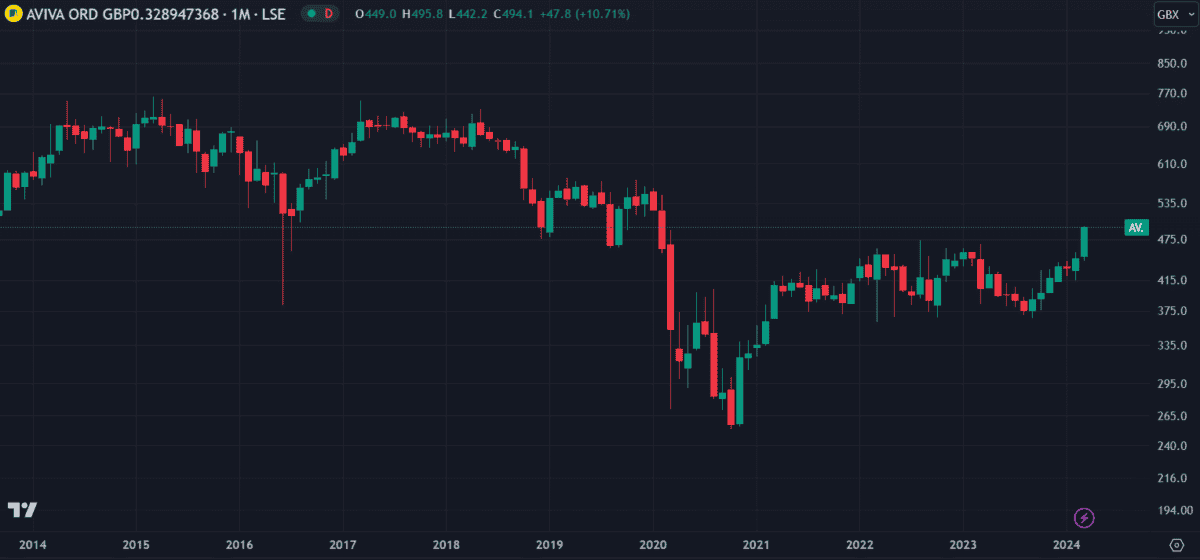
The shares have been up and down for the past four years and dipped quite a bit throughout 2023. Because of this, I was initially put off and didn’t circle back until it was too late. The price took off this month after Aviva announced its 2023 full-year (FY) results. They revealed a 9% increase in operating profit, a £300m share buyback program and an 8% rise in dividends.
The share price is already up 17.9% since then.
But the last few months saw even better returns. Since hitting a low of 369p on 8 September, the price has recovered 33% – an impressive climb in just under seven months.
If I’d invested £5,000 back then I’d already have secured myself a decent £1,650 in returns. That’s not bad for only six months. Had I instead bought the shares of Aviva competitor Prudential, I’d be £600 out of pocket!
So with Aviva now at a four-year high, what does the future hold?

Calculating value
Using a discounted cash flow (DCF) model, analysts estimate Aviva to be undervalued by 34%. This doesn’t necessarily mean the share price will increase by 34%, simply that the price seems low compared to earnings.
A DCF model determines value by dividing future cash flow forecasts by a company’s weighted average cost of capital (WACC) and subtracting debt. While it can provide a relatively good idea of value, it relies heavily on the accuracy of future cash flow forecasts. If external factors or unexpected events alter cash flow, then the calculations must be revisited.

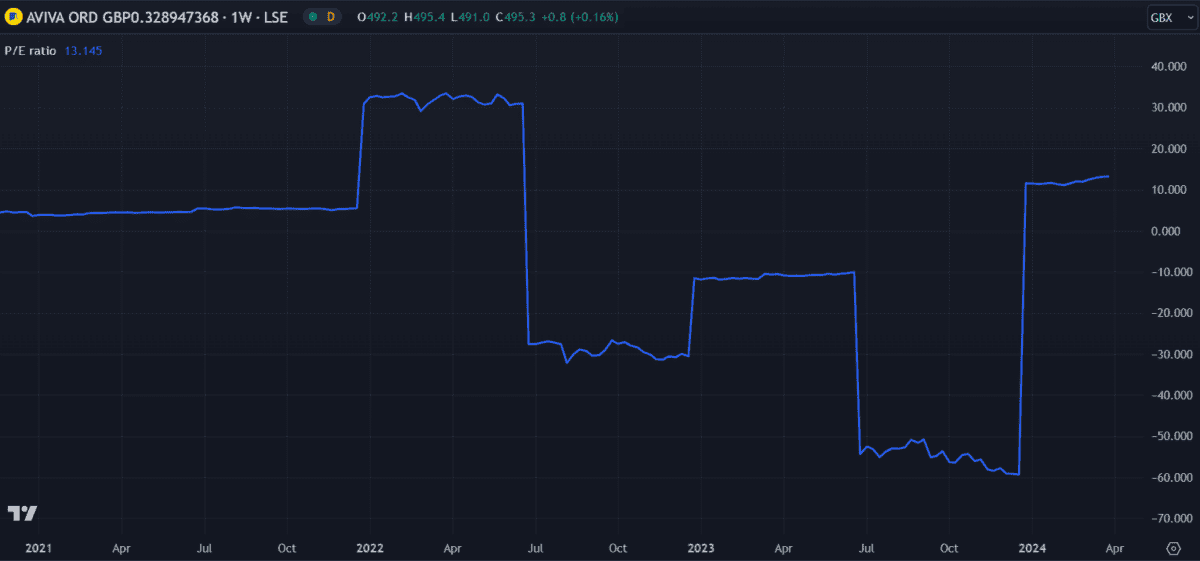
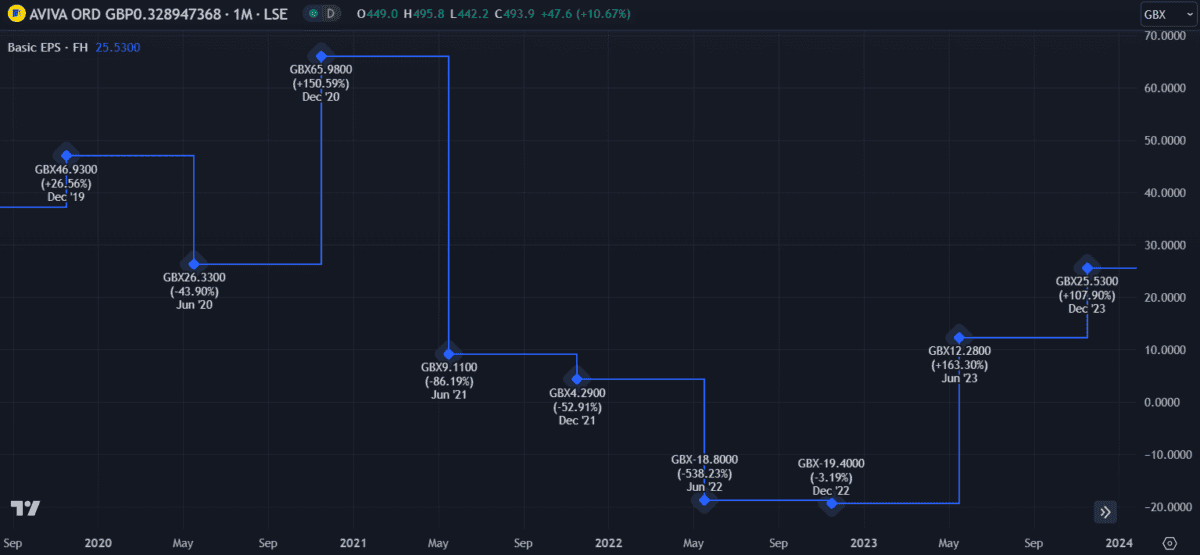
The price-to-earnings (P/E) ratio is another metric used to evaluate a company. To get a P/E ratio, divide the share price by the company’s earnings per share (EPS). EPS is calculated by dividing net income by outstanding shares. With a trailing P/E ratio of 13, Aviva is lower than Prudential (15.8) and Admiral Group (25), but higher than the industry average of 10.8.
This indicates that Aviva shares could be slightly expensive compared to others in the same industry.

Balance sheet
Evaluating growth potential is one thing but it’s all for nothing if the company goes bankrupt. By checking the balance sheet we can evaluate the company’s financial position.
Debt is key here.
Using debt responsibility can spell the difference between success and failure. Companies that don’t use any debt may fail to compete with others, while companies that don’t manage debt properly could default on loans and go bankrupt.

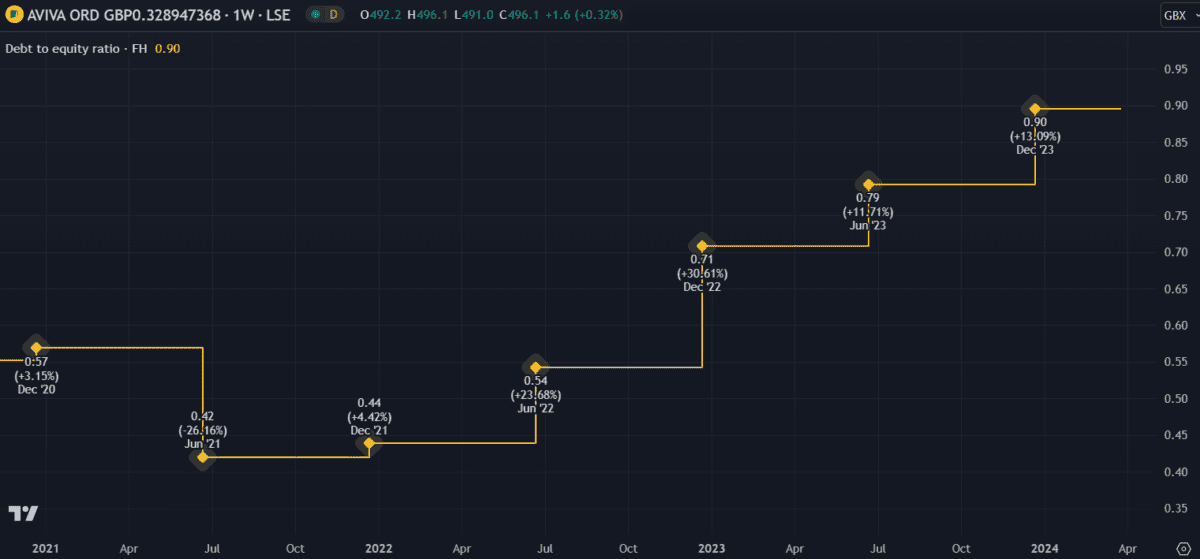
Aviva’s debt-to-equity (D/E) ratio has been steadily increasing over the past few years. Now at 0.9, it’s dangerously close to a factor of one – which would mean it’s not fully covered by shareholder equity. However, in Aviva’s case, the company has sufficient cash and operating income to cover its debt, leaving it with an interest coverage ratio of 6.7 times.
Overall, I think Aviva is in a good position but I don’t expect the share price to make significant gains from here. I will hold my shares for now but, sadly, I think I missed the best price entry point.


